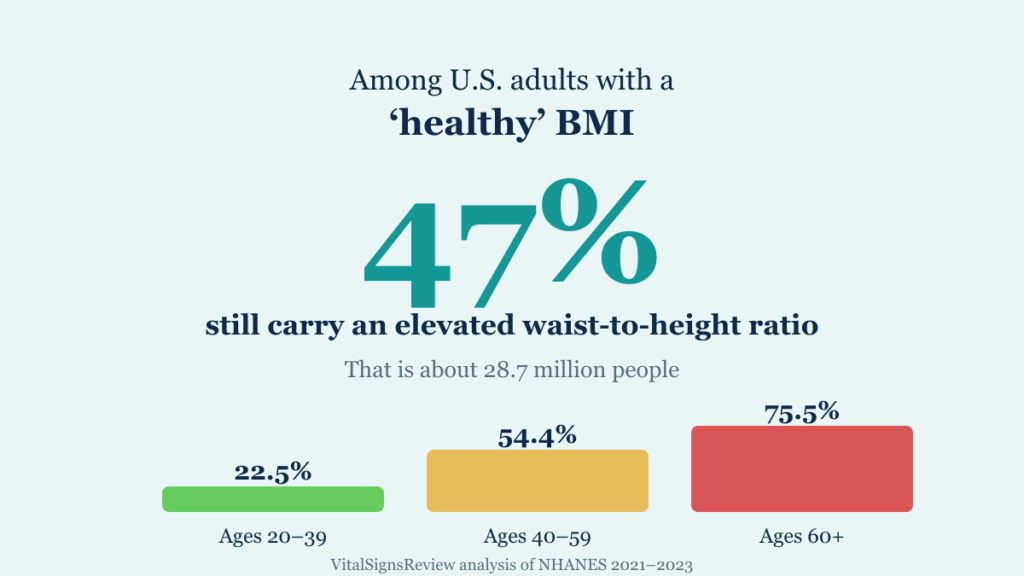
📊 Original analysis. We analysed the CDC’s National Health and Nutrition Examination Survey (NHANES) 2021–2023 ourselves. Full method and limitations are below, and the figures are free to cite with attribution.
Body mass index has one well-known weakness: it cannot tell you where your weight sits. Two people of identical height and weight — identical BMI — can carry completely different amounts of the visceral fat that actually drives metabolic risk. Waist-to-height ratio captures what BMI misses, and it needs nothing but a tape measure.
So we asked a specific question of the most recent national data: among American adults whose BMI falls in the “healthy” range, how many still have an elevated waist-to-height ratio?
The answer is 47%.
What we found
Among U.S. adults aged 20 and over with a BMI between 18.5 and 24.9 — the range routinely described as healthy — 47.0% (95% CI 42.5–51.5) had a waist-to-height ratio of 0.5 or above, the threshold commonly used to flag elevated cardiometabolic risk.
Applied to the population those participants represent, that is roughly 28.7 million American adults whose BMI reads as reassuring while their waist does not.
The pattern by age is the most striking part of the result.
Elevated waist-to-height ratio among adults with a healthy BMI, by age
Weighted prevalence with 95% confidence intervals. NHANES 2021–2023, adults 20+ with BMI 18.5–24.9.
At ages 20 to 39, fewer than a quarter of healthy-BMI adults had an elevated ratio. By age 60 and over, three quarters did. Since BMI stayed in the same band across all three groups by definition, this is a picture of fat redistributing with age while the scale stays quiet — the muscle loss and hormonal shifts described in why you gain weight after 50.
Women in the healthy-BMI group were somewhat more likely to have an elevated ratio than men (50.3%, CI 44.8–55.9, versus 42.9%, CI 36.0–49.8), though the intervals overlap enough that we would not lean on that difference.
The two measures disagree about half the country
Looking at all 5,745 adults in our sample rather than only the healthy-BMI group, the gap between the two definitions is large.
Two ways of counting the same population
A gap of 42.9 percentage points among the same 5,745 adults.
Obesity by BMI came out at 40.0% (CI 36.5–43.5). An elevated waist-to-height ratio came out at 82.9% (CI 80.5–85.4). Both describe the same people.
Two things follow. First, our BMI figure of 40.0% closely matches the CDC’s own published obesity estimate for this period, which is a useful check that our survey weighting is behaving correctly. Second, the 0.5 threshold is clearly a sensitive screening cut-off rather than a diagnostic one — when a marker flags four out of five adults, it is identifying a broad risk gradient, not a discrete disease. That is worth saying plainly, because it is the main limitation of the headline number.
Even restricting to adults who are not obese by BMI, 71.6% (CI 68.7–74.4) had an elevated ratio. Among those in the overweight BMI band of 25 to 29.9, it was 94.6% (CI 92.9–96.3) — effectively everyone.
Race and ethnicity
Among healthy-BMI adults, by race and ethnicity
Small subgroup samples produce wide intervals — read these as indicative, not precise.
The spread here matters for a technical reason. A single 0.5 threshold is applied to everyone, but body-fat distribution at a given waist size genuinely differs by ancestry. Several bodies recommend lower waist thresholds for people of South and East Asian descent, which means the 54.4% we measured in the Asian group at a 0.5 cut-off probably understates risk rather than overstating it. The lower figure in the Black non-Hispanic group is consistent with known differences in fat distribution and is based on a small subsample, so its interval is wide.
We report these numbers because they are informative about the threshold, not because they describe anything inherent about the groups.
What this does and does not mean
It does not mean 28.7 million Americans are secretly ill. Waist-to-height ratio is a risk marker on a continuous scale, and 0.51 is not meaningfully different from 0.49.
What it does mean is that a normal BMI is weaker reassurance than most people take it to be, particularly after 40. If you have been told your weight is fine and never had your waist measured, you have had half of the assessment. The clinical context for that is in normal-weight obesity and metabolic syndrome, where waist circumference is one of five criteria.
The practical response is not alarm. It is a tape measure, and if the ratio is above 0.5, a conversation with a doctor that includes blood pressure, fasting glucose and a lipid panel — because the value of this marker is that it points toward things that are worth measuring properly.
How to check your own
Divide your waist by your height in the same units. Measure at the top of your hip bones, at the end of a normal exhale, tape snug but not compressing — not at the narrowest point, and not holding your breath. Our waist-to-height ratio calculator does the arithmetic. More context in why waist size predicts health better than the scale and how to lose belly fat.
Method
Data. NHANES 2021–2023 public-release files, downloaded from the CDC: demographics (DEMO_L) and body measures (BMX_L).
Sample. Adults aged 20 and over with valid measured waist circumference, standing height, BMI and a positive MEC examination weight. Analytic n = 5,745, representing approximately 232.8 million adults. The healthy-BMI subgroup was n = 1,468, representing about 61.0 million.
Measures. Waist-to-height ratio calculated as measured waist circumference divided by measured standing height, both in centimetres; elevated defined as 0.5 or above. BMI as measured and reported in the file, with the healthy range taken as 18.5 to 24.9 and obesity as 30 or above.
Estimation. All prevalences are weighted using the two-year MEC examination weight (WTMEC2YR). Standard errors account for the complex survey design — stratification (SDMVSTRA) and primary sampling units (SDMVPSU) — using Taylor-series linearisation for a ratio estimator. Confidence intervals are 95% and symmetric on the proportion scale, so intervals near the boundaries should be read loosely.
Reproducibility check. Applying the same pipeline to BMI-defined obesity returned 40.0%, consistent with the CDC’s published estimate for the period. We report this because a weighting error would most likely have shown up here first.
Limitations
Cross-sectional. This is a single snapshot. It shows association and distribution, not cause, and it cannot tell you what happens to any individual over time.
The 2021–2023 cycle is unusual. NHANES data collection was disrupted around the COVID-19 pandemic, and the CDC advises caution when comparing this cycle with earlier ones. We deliberately made no historical comparisons for that reason.
One measurement occasion. Waist circumference varies with posture, breathing, recent meals and measurement technique, even in trained hands.
A universal threshold is a compromise. As discussed above, 0.5 is a screening convention rather than a biological boundary, and appropriate cut-offs differ by ancestry.
Small subgroups. Some race and ethnicity cells contain fewer than 150 participants, giving wide intervals. Do not quote those figures as precise.
Not peer reviewed. This is our own analysis of public data, published with its method stated so that anyone can check or contradict it. It has not been through journal review.
Citing this
VitalSignsReview analysis of NHANES 2021–2023. “Nearly half of U.S. adults with a healthy BMI have an elevated waist-to-height ratio.” Available at https://vitalsignsreview.com/nhanes-healthy-bmi-elevated-waist/
Journalists and researchers are welcome to use these figures with attribution. If you would like the analysis script or a specific additional breakdown, get in touch through our contact page — we will run it.
The honest bottom line
Nearly half of American adults with a BMI in the healthy range carry an elevated waist-to-height ratio, rising from under a quarter in their twenties and thirties to three quarters after 60. The 0.5 threshold is deliberately sensitive and flags a large share of the population, which is the main caveat on that number. But the direction of the finding is not in doubt: BMI alone is an incomplete assessment, the correction costs nothing, and a tape measure is the cheapest health measurement anyone owns.
A new JAMA Network Open study reached a compatible conclusion from the other direction: a tape measure matched the complex obesity definitions.
Frequently asked questions
What is a healthy waist-to-height ratio?
A ratio below 0.5 is the commonly used target, meaning your waist measures less than half your height. Our analysis found 47% of US adults with a healthy BMI exceed it, so it is a sensitive screening threshold rather than a diagnosis.
Is waist-to-height ratio better than BMI?
It captures something BMI cannot: where fat is stored. Central fat drives cardiometabolic risk, and two people with identical BMI can have very different waists. Our data show the two measures classify the same population very differently.
Can you have a normal BMI and still be at risk?
Yes. In NHANES 2021-2023, 47% of adults with a BMI between 18.5 and 24.9 had a waist-to-height ratio of 0.5 or above, rising to 75.5% among those aged 60 and over.